Top 15 Best Cloud Monitoring Tools To Optimize Performance
Explore the top 15 advanced cloud monitoring tools to optimize performance, improve visibility, and automate issue detection for your cloud infrastructure.

Cloud environments are the basis of many businesses, but managing them without the right monitoring tools can be challenging. Without real-time insights, companies can easily miss performance issues, struggle to identify system obstacles. This can lead to service disruptions, slow app performance, and security vulnerabilities, all of which can disrupt business operations.
Cloud monitoring tools are key to keeping everything running smoothly. They ensure optimal performance, scalability, and security, providing real-time alerts, detailed analytics, and actionable insights that help businesses stay ahead of potential problems.
In this guide, we’ll explore 15 of the best cloud monitoring tools available, each designed to deliver comprehensive insights and proactive alerts to keep your cloud infrastructure operating at its best.
Best Cloud Monitoring Tools
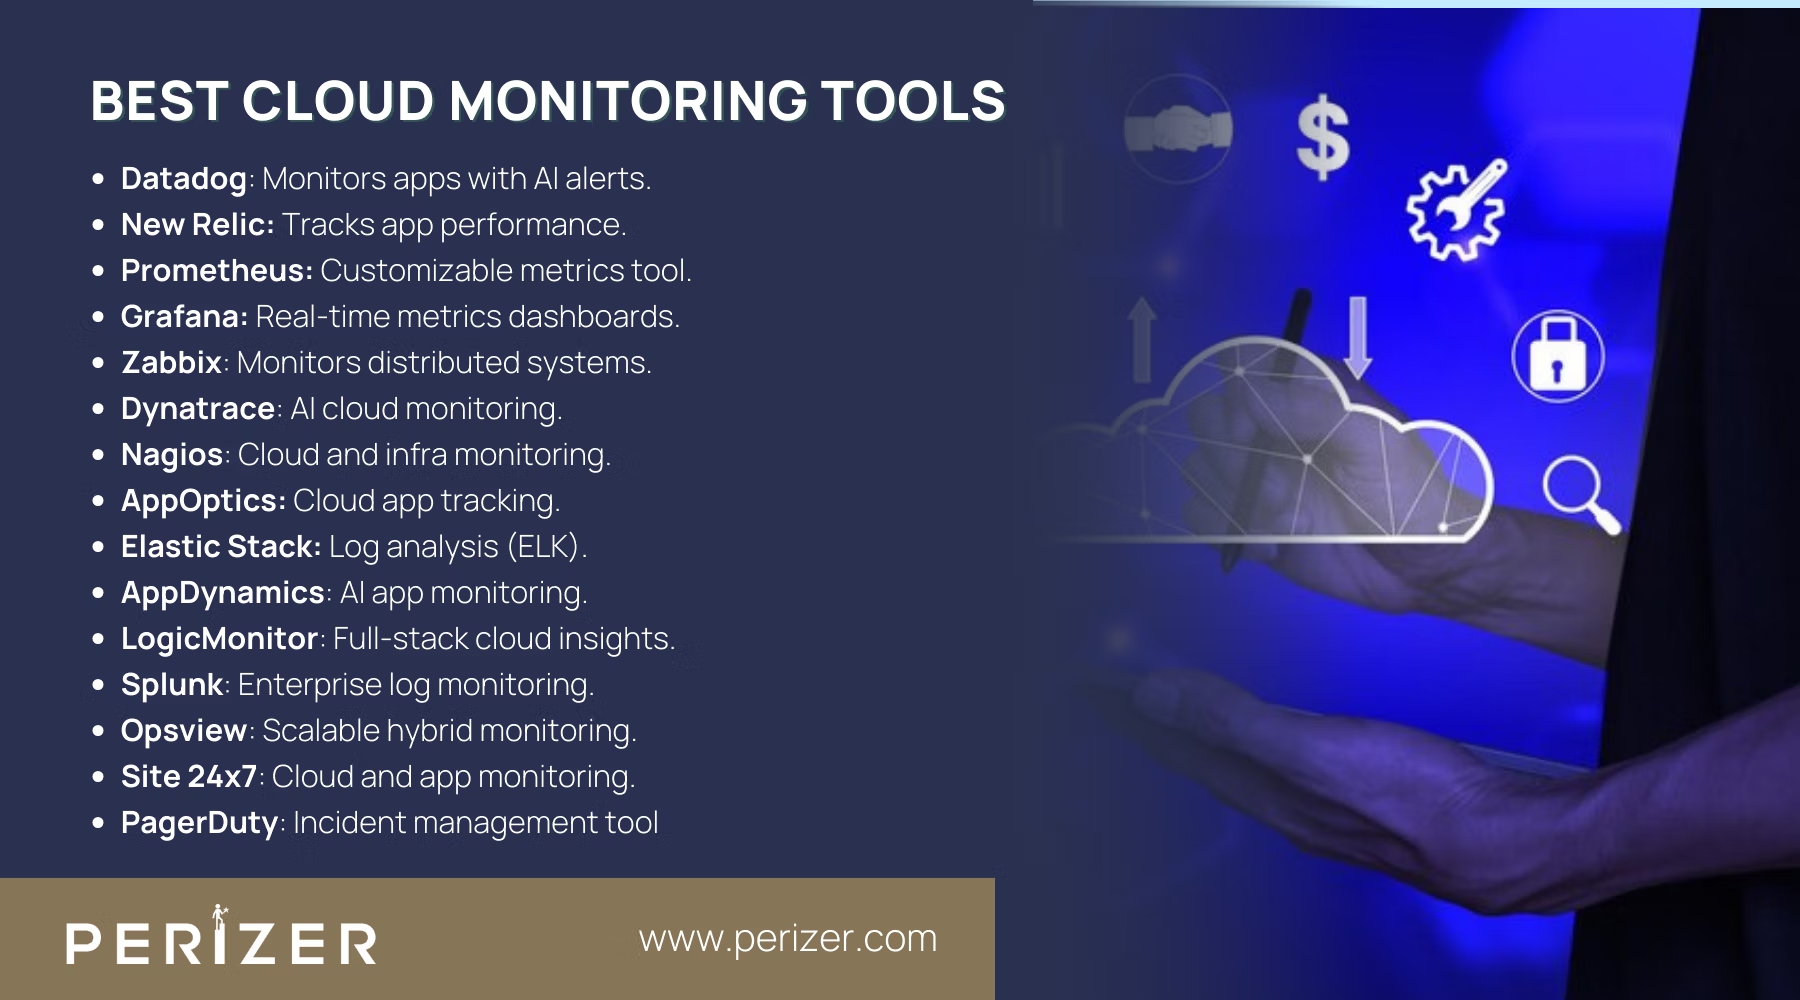
1. Datadog
Datagdog provides a comprehensive platform for monitoring and analytics. It integrates with various data sources to deliver real-time visibility into application performance, infrastructure health, and logs. Its AI-driven alerts help identify and address issues proactively, making it suitable for dynamic and complex environments.
How Does It Work?
Datadog uses a unified platform that correlates metrics and logs across multiple cloud environments. By setting up custom dashboards and automated alerts, you can identify and resolve issues proactively. Datadog is best in distributed systems and microservices architecture. It provides visibility into both performance metrics and logs.
Why It’s Advanced?
Datadog’s real strength is its ability to pull in data from various cloud platforms and connect the dots, helping you quickly identify any obstacles. It also uses AI-driven anomaly detection to alert you before small issues become big problems.
2. New Relic
New Relic offers deep insights into application performance through detailed transaction tracing and synthetic monitoring. It helps developers and operations teams understand application behavior, detect obstacles, and optimize performance. Its user-friendly interface provides actionable insights and detailed performance metrics.
How Does It Work?
New Relic does more than just monitor your infrastructure. It gives you deep insights into how your applications are performing, letting you track things like transaction times, error rates, and throughput. With its synthetic monitoring feature, you can replicate real user behavior to ensure your applications are always running smoothly.
Why It’s Advanced?
The New Relic's ability to break down and visualize complex transaction traces, makes it easier to identify issues. If your organization is using microservices, this can save hours of manual troubleshooting.
3. Prometheus
Prometheus is an open-source monitoring system designed for modern, cloud-native environments. It is best for collecting and storing time-series data and offers powerful querying capabilities. Prometheus is known for its flexibility and scalability, making it a popular choice for dynamic and containerized applications.
How Does It Work?
Prometheus works by scraping metrics from endpoints at specified intervals and storing them in a time-series database. The tool performs in cloud-native environments, especially those using as it was designed to handle dynamic environments with temporary workloads.
Why It’s Advanced?
Unlike some of the more general tools, Prometheus is all about customization. You can define your custom metrics and create highly specific monitoring solutions for unique needs, which is invaluable in more complex infrastructures.
4. Grafana
Grafana specializes in visualizing real-time metrics through highly customizable dashboards. It supports a wide range of data sources, allowing users to create interactive and informative visualizations. Grafana’s flexibility makes it a preferred choice for integrating and analyzing data across different systems.
How Does It Work?
Grafana connects with multiple data sources to create highly customizable dashboards that visualize metrics in real time. Its flexibility allows it to integrate with databases like, Elasticsearch, and more.
Grafana is great for teams that need customized visualizations and alerts. It lets you set specific thresholds and create visuals that make it easier to spot issues in complex systems quickly.
5. Zabbix
Zabbix provides powerful real-time monitoring for large-scale, distributed systems. It supports extensive API integration, allowing for automation and customization. Zabbix is valued for its scalability and comprehensive monitoring capabilities, making it suitable for diverse IT environments.
How Does It Work?
Zabbix monitors the availability and performance of your cloud infrastructure through a flexible set of APIs. It offers real-time monitoring, historical data storage, and advanced alerting. Its distributed monitoring capability allows you to keep tabs on multiple regions without affecting performance.
Zabbix’s extensibility allows for a high level of customization, from metrics collection to notification systems. It integrates well with DevOps tools, making it a perfect fit for advanced automation.
6. Dynatrace
Dynatrace delivers AI-powered monitoring that automatically detects and resolves issues in cloud environments. It offers end-to-end visibility into application performance and infrastructure health. Dynatrace's advanced AI capabilities improve its ability to provide actionable insights and optimize performance.
How Does It Work?
Dynatrace uses AI-driven insights to automatically detect issues, anomalies, and performance degradations in real time. Its agent automatically discovers and maps dependencies between services, offering a holistic view of your cloud ecosystem.
Dynatrace has its AI-powered causation engine, which not only identifies problems but also suggests fixes. It’s incredibly valuable when managing large-scale, complex environments where manual troubleshooting could take hours or days.
7. Nagios
Nagios is a versatile monitoring tool that supports both cloud and traditional infrastructure. It is highly configurable and supports a wide range of plugins, making it adaptable to various monitoring needs. Nagios is known for its flexibility and ability to provide detailed monitoring across different systems.
How Does It Work?
Nagios uses plugins to collect metrics from cloud services and local systems. It provides comprehensive visibility into the availability of cloud resources, along with support for custom scripts for advanced monitoring needs.
Its flexibility in integrating with both modern cloud services and traditional infrastructure makes Nagios an excellent tool for hybrid cloud environments.
8. SolarWinds AppOptics
AppOptics provides monitoring for cloud applications with distributed tracing. It helps track performance metrics and diagnose issues in real-time. AppOptics is designed to offer detailed insights into application behavior and infrastructure performance.
How Does It Work?
AppOptics provides distributed tracing and infrastructure monitoring, focusing on applications running in cloud environments. It visualizes metrics in an intuitive, user-friendly interface while offering deep-dive capabilities into application behavior.
AppOptics integrates seamlessly with AWS and other cloud providers, offering powerful distributed tracing that gives you full visibility into even the most complex cloud applications, helping keep them optimized and running smoothly.
9. Elastic Stack (ELK)
Elastic Stack comprising ElasticResearch,, and Kibana, is a powerful suite for log analysis and visualization. It allows users to search, analyze, and visualize large volumes of log data in real time. The ELK stack is widely used for its scalability and flexibility in handling diverse data types.
How Does It Work?
ELK works by ingesting data from various cloud sources, transforming and visualizing it to help you monitor performance and troubleshoot issues. Elasticsearch stores data, Logstash processes it, and Kibana provides real-time visualizations.
ELK offers one of the most customizable log analysis systems available, which can scale alongside your cloud infrastructure. Its flexibility in data handling is a significant advantage for companies dealing with large volumes of logs and metrics.
10. AppDynamics
AppDynamics offers AI-driven monitoring for cloud applications, focusing on performance insights and anomaly detection. It provides detailed analytics and helps optimize application performance by identifying and resolving issues quickly. AppDynamics is valued for its advanced capabilities in application performance management.
How Does It Work?
AppDynamics uses AI-powered insights to monitor the performance of cloud applications, automatically detecting performance obstacles and suggesting fixes. You can monitor cloud resource consumption alongside application performance to ensure both are optimized.
AppDynamics is best in dynamic cloud environments, providing real-time updates on the performance of microservices, containers, and serverless architectures.
11. LogicMonitor
LogicMonitor provides automated, full-stack cloud monitoring with real-time insights. It offers comprehensive visibility into both cloud infrastructure and applications. LogicMonitor's ease of use and automated features make it suitable for organizations seeking a streamlined monitoring solution.
How Does It Work?
LogicMonitor automatically discovers devices and services within your cloud environment and sets up monitoring with minimal manual configuration. It integrates with multiple cloud platforms, offering real-time insights into performance and availability.
Its scalability and flexibility make it a great tool for large enterprises managing extensive cloud infrastructures. The ability to automate much of the monitoring process helps streamline operations.
12. Splunk
focuses on enterprise log monitoring, offering actionable insights into cloud operations. It allows users to search, analyze, and visualize log data from multiple sources. With its strong analytics features, Splunk helps teams quickly detect issues and make sense of complex IT environments
How Does It Work?
Splunk collects, analyzes, and visualizes large volumes of log data from cloud infrastructure. It offers deep insights into cloud performance, security, and operational efficiency through customizable dashboards and powerful querying capabilities.
Splunk’s advanced alerting and real-time data processing make it an ideal choice for organizations needing detailed, actionable insights from their cloud operations.
13. Opsview
Opsview offers scalable monitoring solutions for cloud and hybrid infrastructures. Its modular features allow for customization and integration with various systems. Opsview is designed to handle complex environments, providing comprehensive monitoring and management capabilities.
How Does It Work?
Opsview monitors cloud services using a modular architecture, allowing you to expand its capabilities as your needs grow. Its multi-tenancy support makes it ideal for enterprises managing multiple teams or customers within a single infrastructure.
The tool offers advanced alerting and integrations with popular DevOps platforms, making it a suitable fit for cloud infrastructures undergoing rapid growth or frequent changes.
14. Site24x7
provides real-time monitoring for cloud platforms, websites, and applications. It offers a range of monitoring services, including uptime checks, performance monitoring, and user experience analysis. Site24x7 is known for its user-friendly interface and comprehensive monitoring features.
How Does It Work?
Site24x7 monitors cloud platforms like AWS, Azure, and Google Cloud, providing real-time data on uptime, performance, and resource utilization. Its simple, intuitive interface makes it easy to monitor cloud resources and set up custom alerts.
Site24x7 excels in multi-cloud environments where teams need comprehensive visibility across platforms. The tool’s ease of use doesn’t compromise its depth of functionality.
15. PagerDuty
PagerDuty focuses on incident management by focusing on and managing alerts for rapid issue resolution. It helps teams respond to incidents quickly and effectively, improving overall operational efficiency. PagerDuty’s capabilities are essential for maintaining high levels of service availability and performance.
How Does It Work?
PagerDuty integrates with multiple monitoring tools to act as a central hub for alerts and incident management. It uses advanced algorithms to help prioritize incidents, ensuring your team addresses the most critical issues first.
The real strength of PagerDuty is its ability to handle large volumes of alerts and prioritize them effectively. This makes it invaluable in cloud environments where quick response times are crucial to maintaining uptime.
Conclusion
Choosing the right cloud monitoring tool is essential for keeping your cloud setup running smoothly and securely. Each tool on this list has unique strengths, whether you're looking for real-time insights, customizable metrics, or AI-driven features. The best fit for you will depend on your specific needs, like the size of your infrastructure, how well it integrates with your existing systems, and how complex your cloud environment is.
Moreover, understanding what each tool offers and how it aligns with your monitoring needs will help you make the right choice. This way, you can improve efficiency, avoid problems, and keep your cloud environment running smoothly.
FOCUSED, FAST, GOVERNMENT READY
Stay Tuned With Our Latest Insights

Staff Augmentation
Learn how to select the perfect IT outsourcing partner to promote your team’s capabilities, improve productivity, and drRead more...

Staff Augmentation
Find the perfect staff augmentation partner by aligning your goals, evaluating expertise, managing costs, and ensuring aRead more...

Cyber Security
We focus on understanding the needs, behaviors, and expectations of your users through extensive user research. This infRead more...